153 Results
View results:
Sort by:
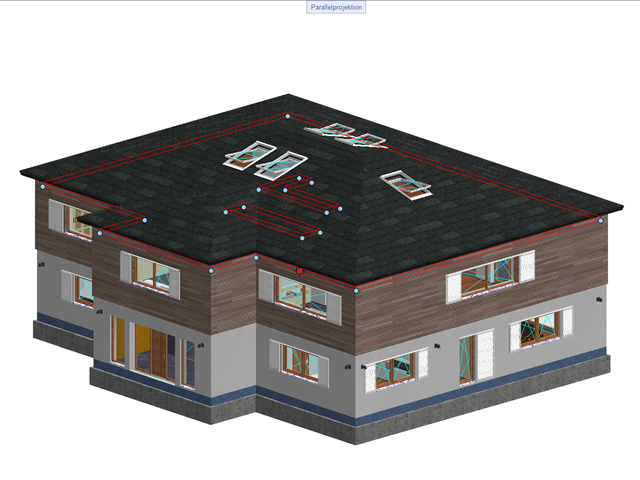
The data exchange between RFEM 6 and Allplan can be done using various file formats. This article describes the data exchange of a determined surface reinforcement using the ASF interface. This allows you to display the RFEM reinforcement values as level curves or colored reinforcement images in Allplan.
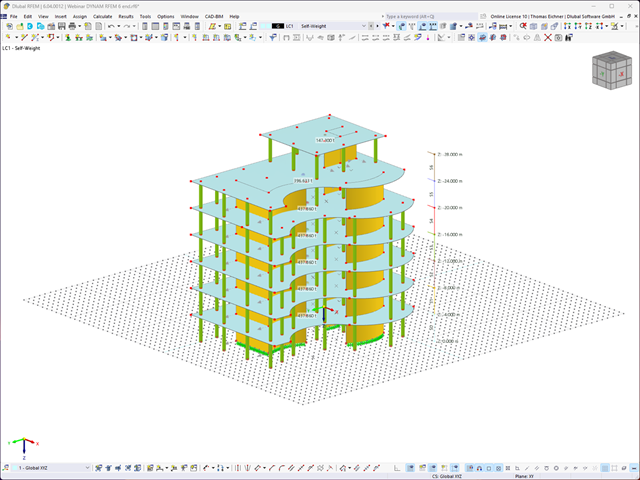
To evaluate whether it is also necessary to consider the second-order analysis in a dynamic calculation, the sensitivity coefficient of interstory drift θ is provided in EN 1998‑1, Sections 2.2.2 and 4.4.2.2. It can be calculated and analyzed using RFEM 6 and RSTAB 9.
The coefficient θ is calculated as follows:$$\mathrm\theta\;=\;\frac{\displaystyle{\mathrm P}_\mathrm{tot}\;\cdot\;{\mathrm d}_\mathrm r}{{\mathrm V}_\mathrm{tot}\;\cdot\;\mathrm h}\;$$
The coefficient θ is calculated as follows:$$\mathrm\theta\;=\;\frac{\displaystyle{\mathrm P}_\mathrm{tot}\;\cdot\;{\mathrm d}_\mathrm r}{{\mathrm V}_\mathrm{tot}\;\cdot\;\mathrm h}\;$$
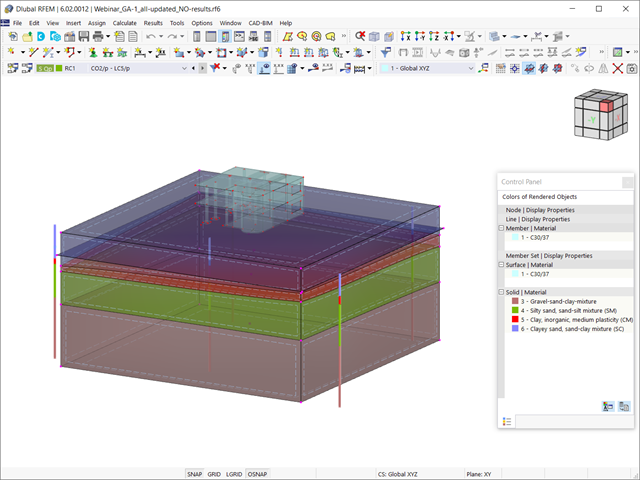
This article discusses the results of the geotechnical analysis and their graphical and tabular display in the RFEM 6 program.
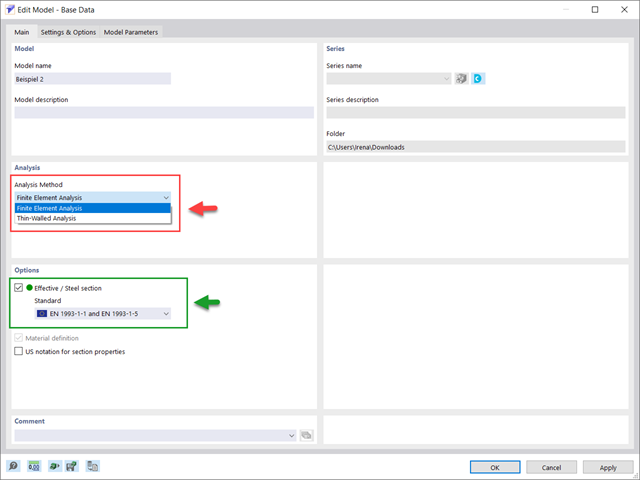
You can use the stand-alone program RSECTION to determine the section properties for any thin-walled and massive cross-sections, as well as to perform a stress analysis. The previous Knowledge Base article titled "Graphical/Tabular Creation of User-defined Cross-sections in RSECTION 1" discussed the basis of defining cross-sections in the program. This article, on the other hand, is a summary of how to determine the section properties and perform a stress analysis.
You can model and analyze masonry structures in RFEM 6 with the Masonry Design add-on that employs the finite element method for the design. Complex masonry structures can be modeled, and static and dynamic analysis can be performed, given that a nonlinear material model is implemented in the program to display the load-bearing behavior of masonry and the different failure mechanisms. You can enter and model masonry structures directly in RFEM 6 and combine the masonry material model with all common RFEM add-ons. In other words, you can design entire building models in connection with masonry.
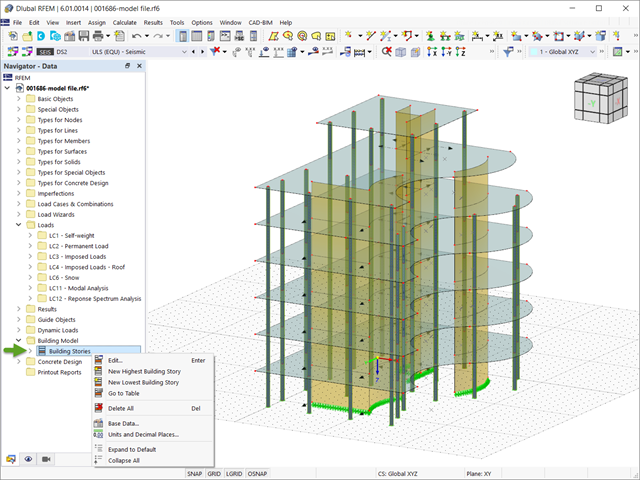
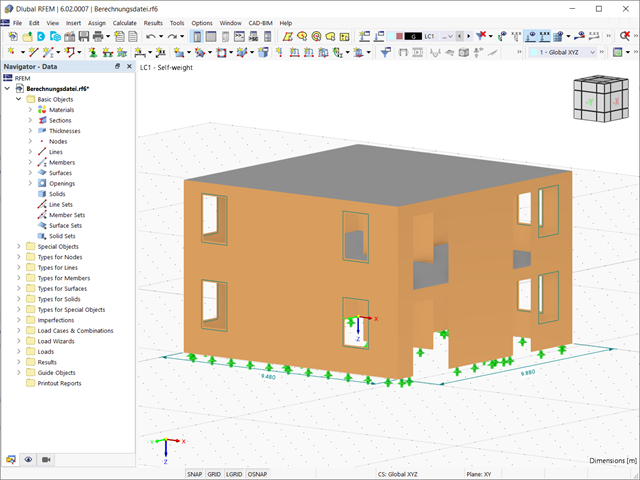
In RFEM 6, seismic analysis can be done by using the Modal Analysis and the Response Spectrum Analysis add-ons. Once the spectral analysis has been performed, it is possible to use the Building Model add-on to display story actions, interstory drifts, and forces in shear walls.
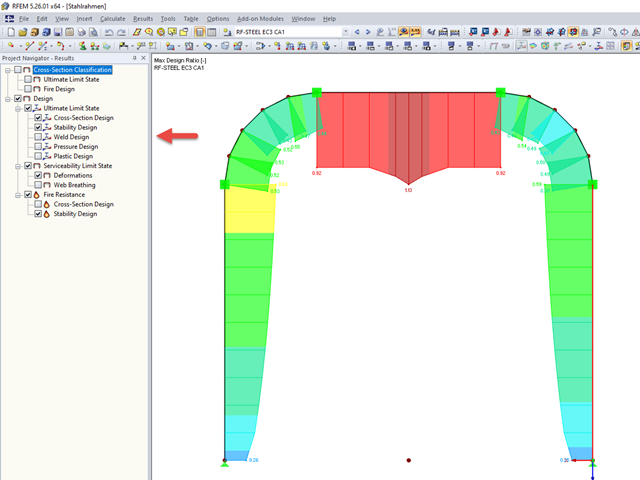
The add-on modules for designing structural member components according to national, European, and international standards also show design results in addition to numerical output in tables graphically, as diagrams displayed on the framework.
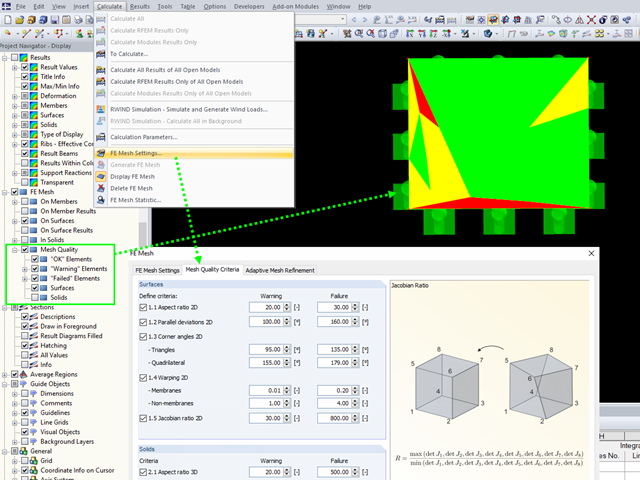
An FE mesh quality display is available in RFEM as a tool for structural analyses of two-dimensional components. It leads to the execution of an internal check of the generated finite elements for defined criteria.
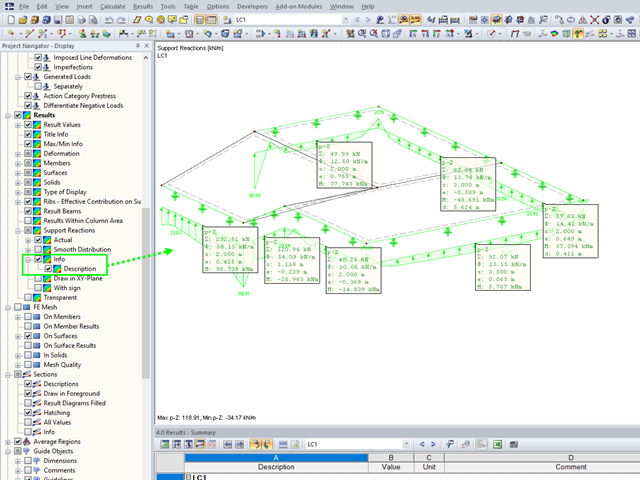
For line supports, there is an option to graphically display the additional information for all directions.
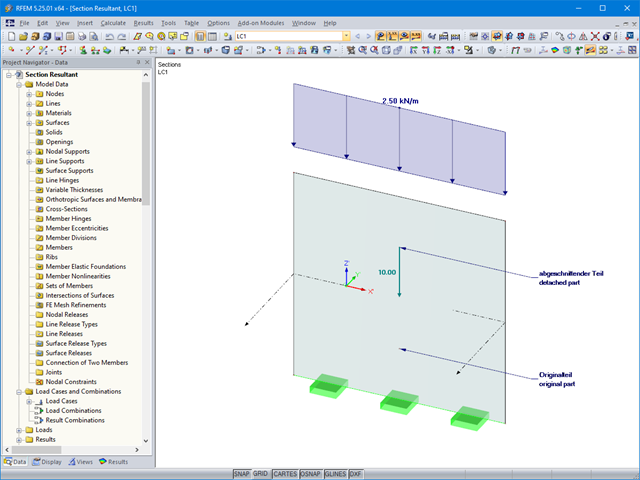
In RFEM, it is possible to display the resultant of a section or release. This article explains which part of the sectional area is affected. The easiest way would be to refer the resultant to a cut face of the surface. However, since a section may run through several surfaces with different local coordinate systems, determination by means of a cut face is not possible.
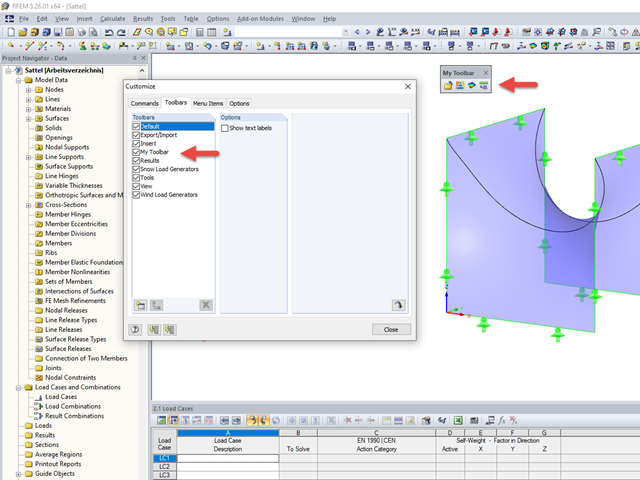
The tools arrangement in the workplace can make your work fast and efficient.
If you want to consider guide objects in the overall view (F8 key or double-click on the mouse wheel) or, for example, in a particular direction of the views, you can enable this option in the settings of the particular guide objects (guidelines, background layers, line grids).
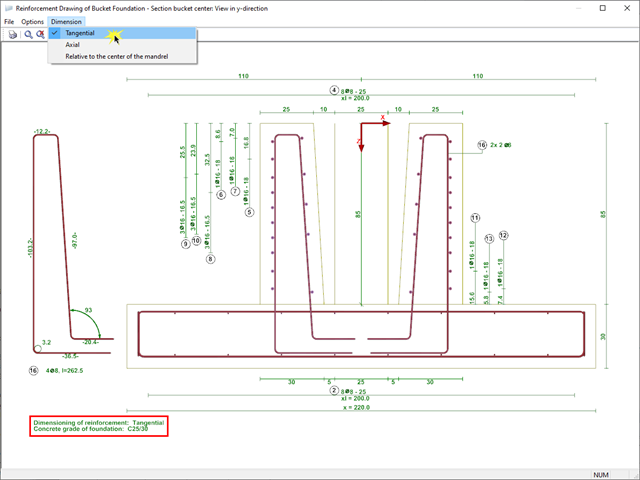
In RF‑/FOUNDATION Pro, reinforcement drawings are displayed after designing the foundation, where you can record all necessary structures of the reinforcement steel.
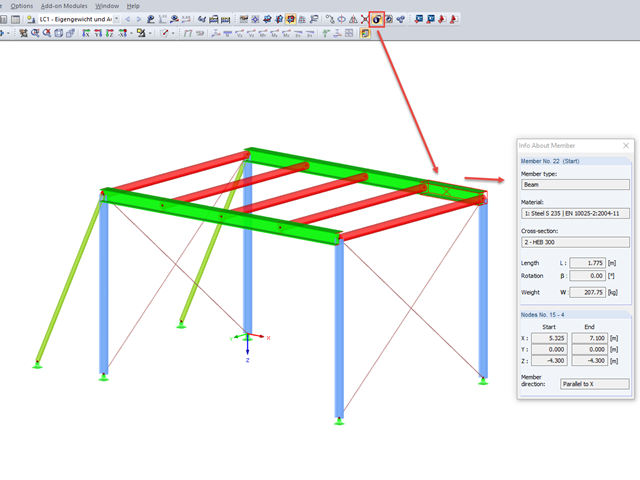
With the "Info About Object..." function available in the menu under "Tools", you can display all the information about an object by placing the cursor on it in the graphical window.
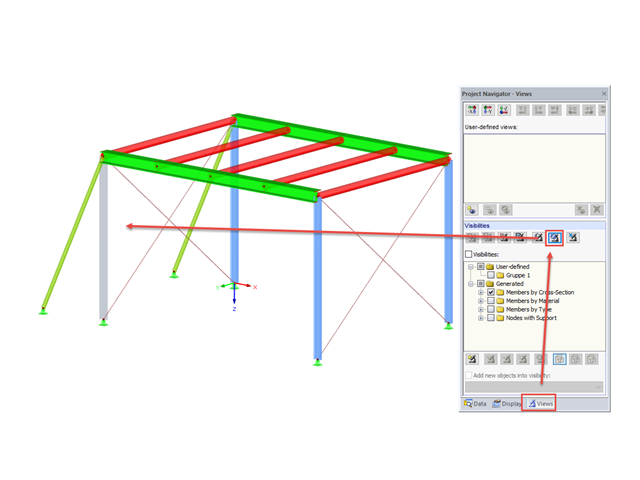
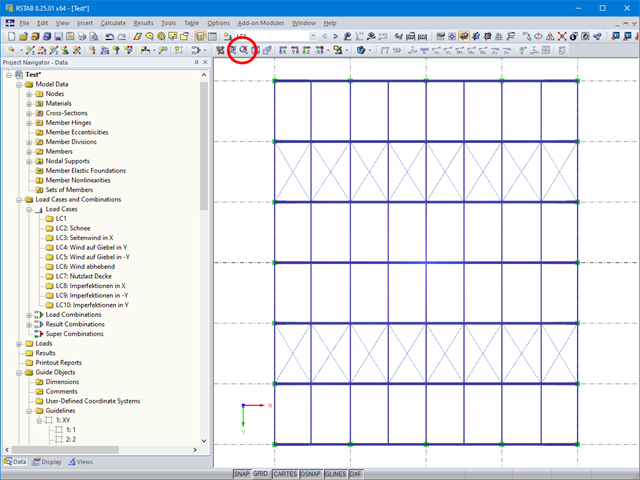
In RFEM and RSTAB, you can apply various visibilities in the Views project navigator.
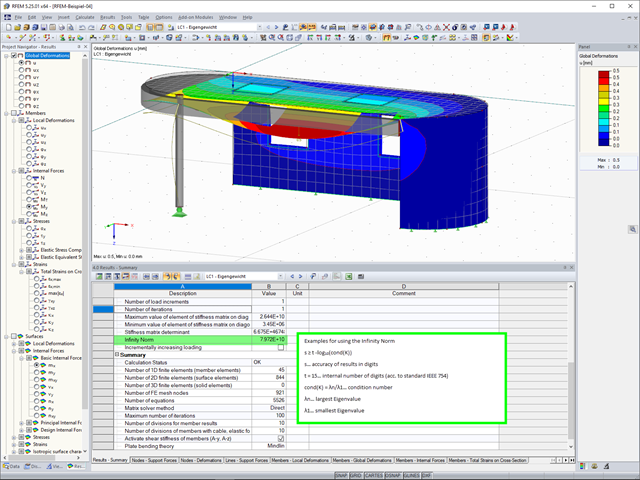
The "4.0 Results - Summary" table displays the infinity norm at the end of the load case results. The norm is used to estimate the largest eigenvalue of a structure. The largest eigenvalue of a structure is estimated by numerical analysis, as accurate determination can be very time-consuming.
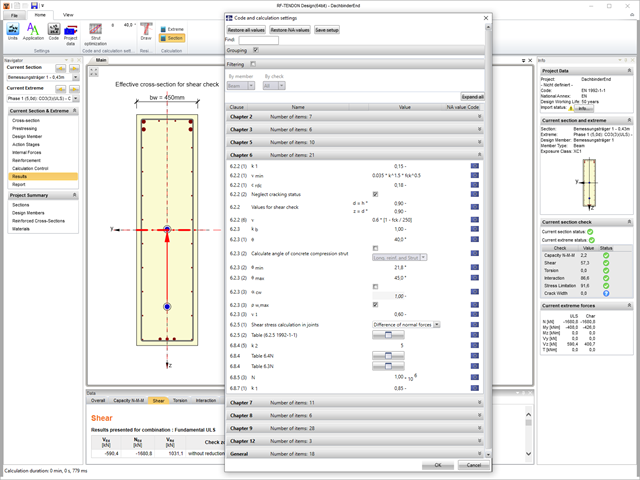
In RF‑TENDON and RF‑TENDON Design, you can review and adjust the code‑dependent factors, calculation parameters, and calculation methods using the "Code" button. You can display the settings and adjustment options according to a chapter of a code, selecting the "Grouping" option in the dialog box.
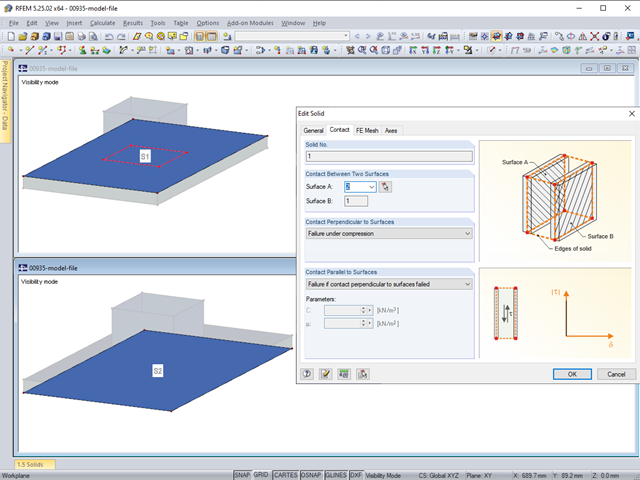
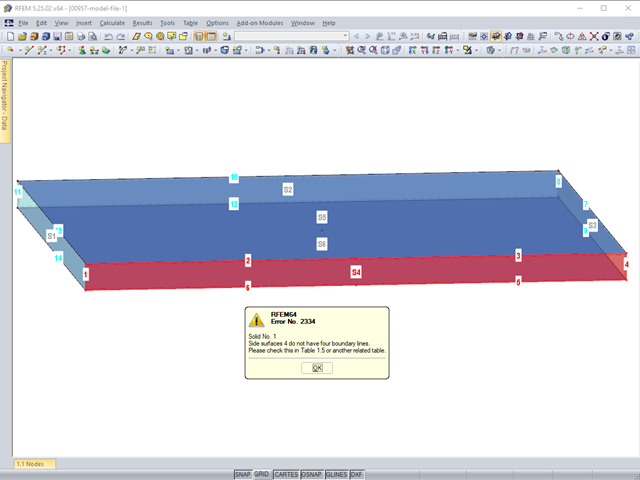
In RFEM, you can display the contact properties between two surfaces by means of contact solids. Among other things, you should ensure that both contact surfaces of a contact solid have the same integrated objects. Therefore, when modeling the contact surfaces, we recommend using the copy function in order to create the second contact surface.
In RFEM, you can display the contact properties between two surfaces by means of contact solids.
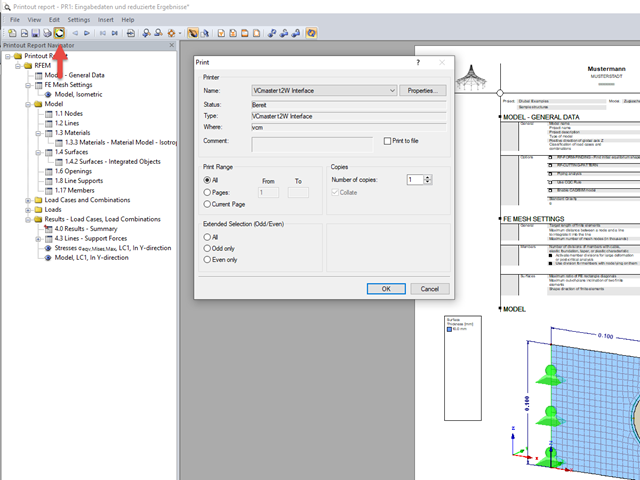
The individually defined printout reports in an RFEM or RSTAB model can be displayed in different ways.
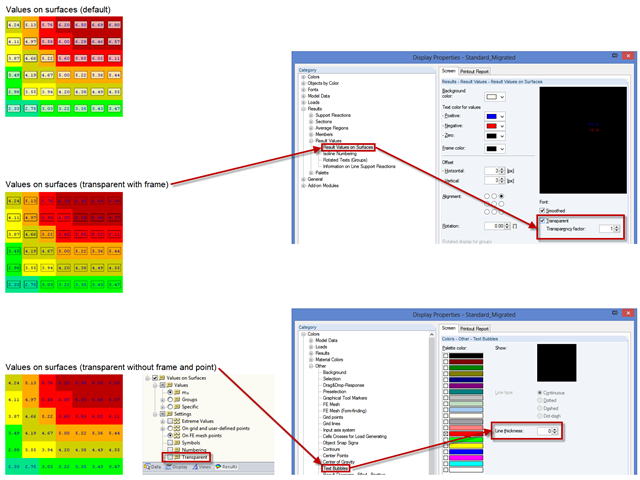
You can make various settings in order to achieve a clearly‑arranged display of the result values. For example, some users may not want the white background in text bubbles. You can adjust the background in "Display Properties" using the Transparent and Background color option.
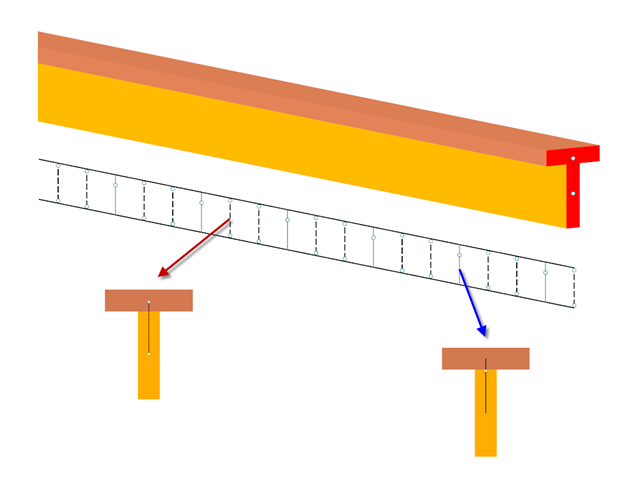
Besides the standardized gamma method, you can display the semi-rigid composite beams also as a framework model.
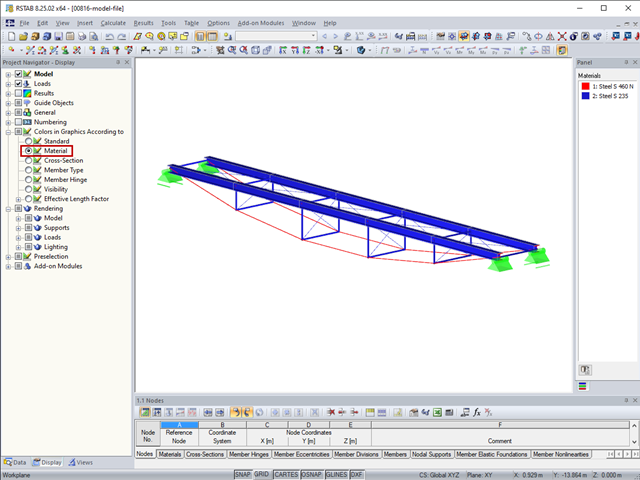
In RFEM and RSTAB, you can visually check or display the materials used for members in the wireframe and solid models.
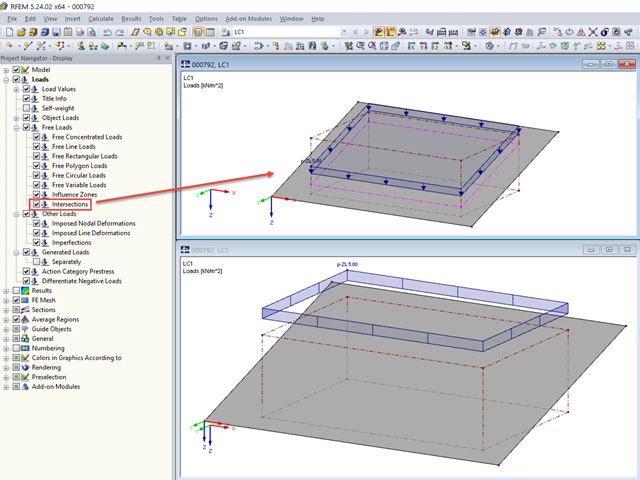
For free loads, RFEM allows you to display the intersections at the respective surface.
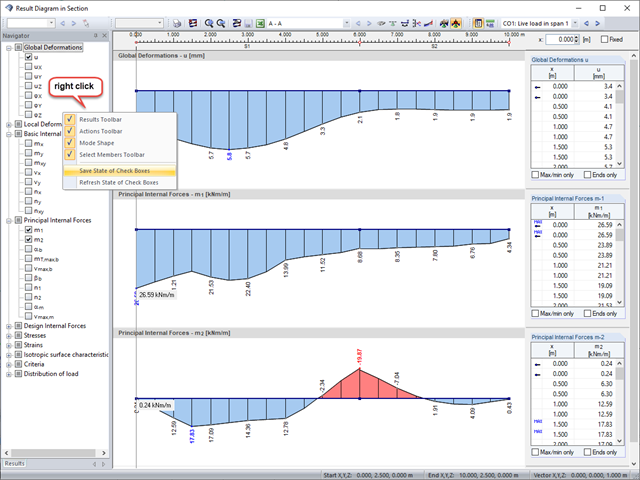
Sections are an excellent way to display and evaluate results clearly. In the RFEM and RSTAB section dialog boxes, you can display several result types at the same time.
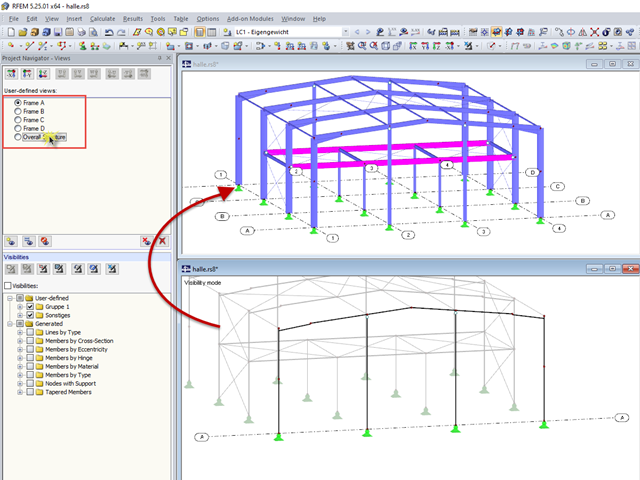
RFEM and RSTAB offer many display options in the Display Navigator. They can be completely different, depending on their function. You often have to click several times to make certain changes. If you want to optimize your work, you can create user‑defined views. In these views, you can save all specified settings. The following example illustrates this principle.
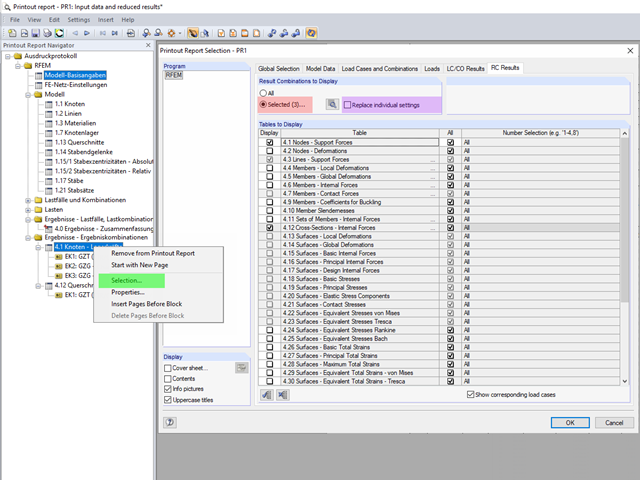
The content to be displayed in the loading and result tables can be managed in the global selection of the printout report (red).
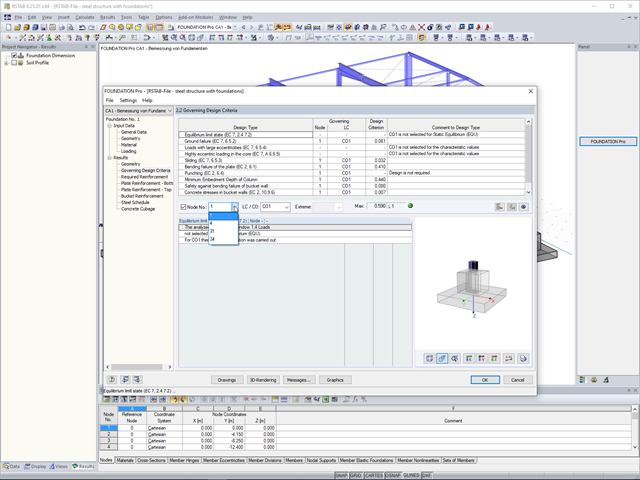
In RF‑/FOUNDATION Pro, you now have the option to design a foundation at one or several nodes of the model.
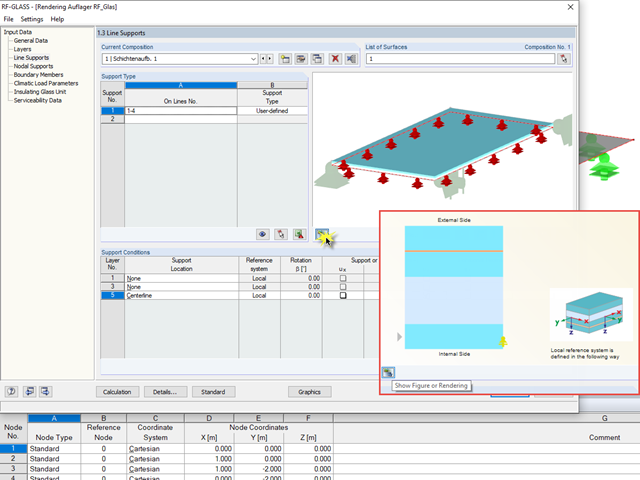
In the RF-GLASS add-on module, 3D rendering is implemented to facilitate the definition of the support conditions. This interactive graphical visualization facilitates the input and control of line and nodal supports. However, the schematic display can also be selected, if necessary.
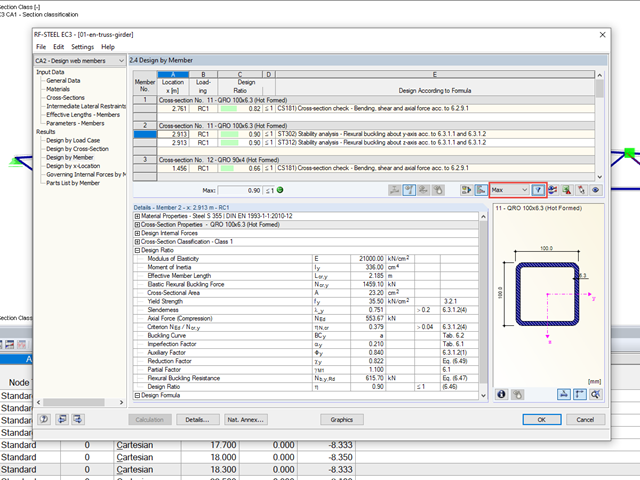
When designing several members in one design case, it is sometimes difficult to recognize the governing design checks. To improve the overview and to display the relevant design checks in a compact way, you can use the filter options under the result tables. These are included in all design modules of steel, aluminum, and timber structures in RFEM and RSTAB.